
We‘re seeing something you‘re not seeing – yet!
This whitepaper is the fourth in our series introducing our campaign toolkit. In the first whitepaper, we covered basics such as channel, touchpoint and interaction. In the second whitepaper, we presented our campaign toolkit for the systematic planning of campaigns. An important element here was the selector. In the third white paper, we used two of our self-developed channel and touchpoint sheets as examples to show how to use the metrics from analytics and tracking for precise analyses and data-based decisions.
Taxonomies – Data catalog
The core of data-driven marketing, whether omnichannel, closed-loop marketing, AI marketing or hyper-personalization, is data.
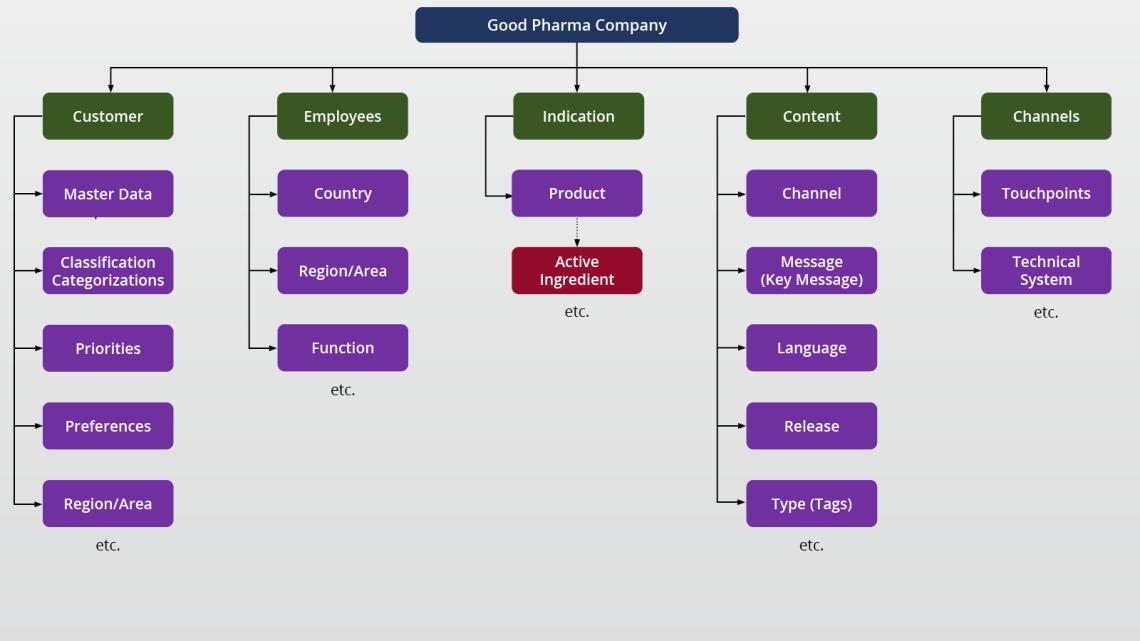
Distributed collections of data are of little use. We need harmonized data in a structured form. Libraries have been using the most sensible method of structuring data, the catalog, for centuries. Instead of sorting books into rooms and shelves according to various characteristics, however, we use data taxonomies.
A data taxonomy is a structured system for organizing and classifying information into hierarchical categories and subcategories. It is used to clearly organize complex data sets and make them more easily accessible.
With this “data catalog”, each entity (in our case, a life sciences company) organizes information individually use it in the best possible way to achieve business goals.
Taxonomies are structured like directories in a computer. Directories can contain data or other directories. This approach creates order and a clear overview, especially if the data structures are highly complex.
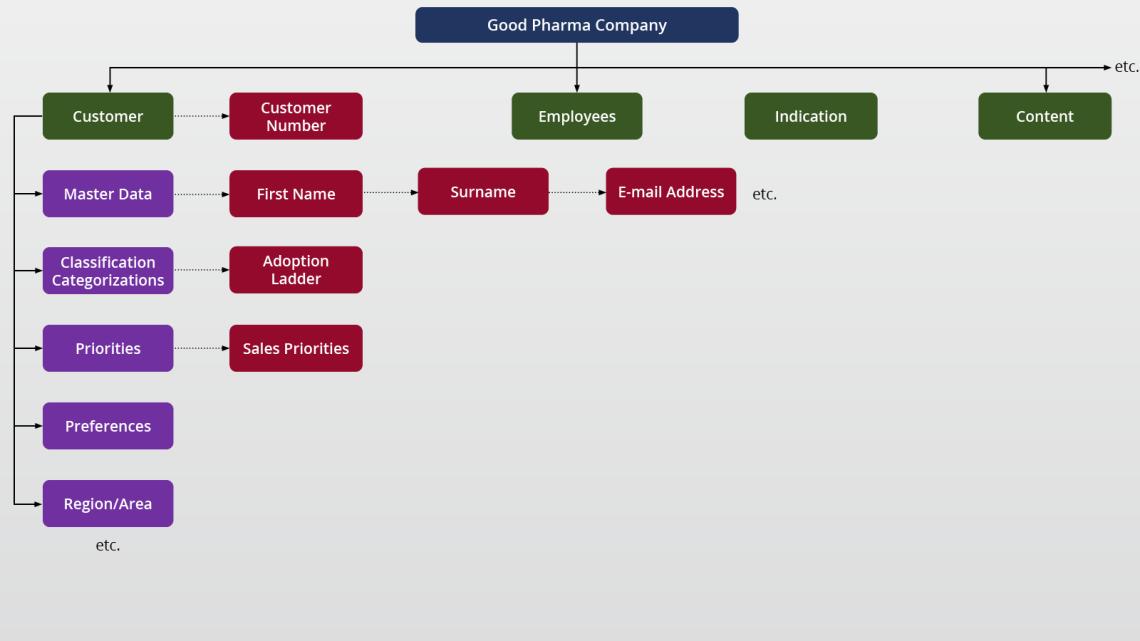
Data can be linked to other data in a taxonomy via relations, even beyond the boundaries of its own structure (i.e. outside of its directory).
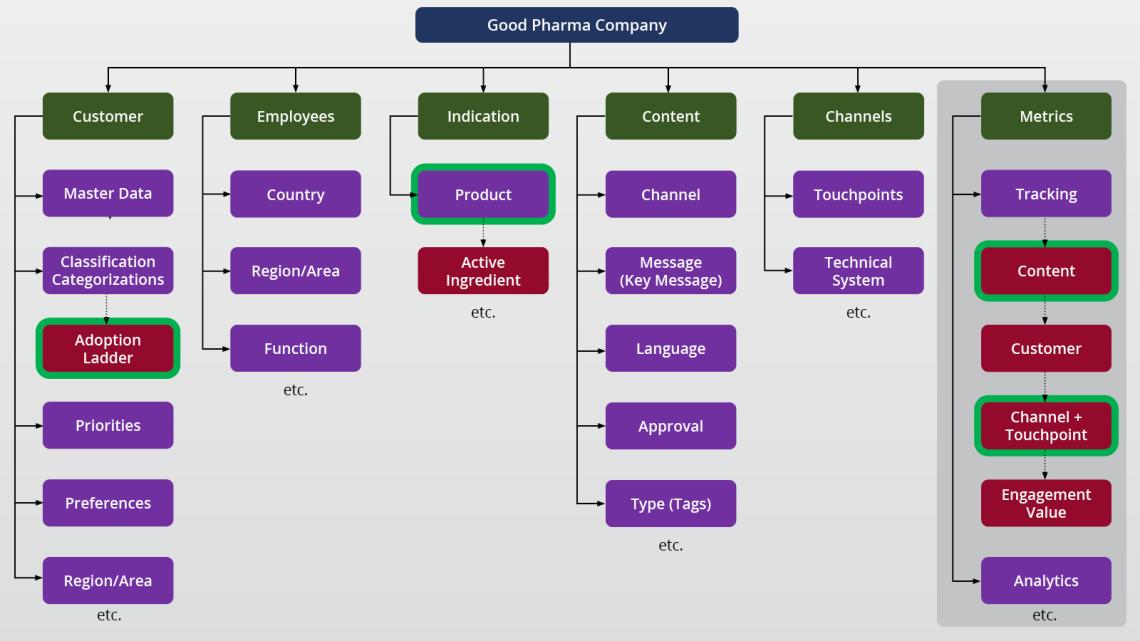
In our example, data from the adoption ladder or sales priorities is always linked to other data – such as the “product”. This is a “relation.”
There is not only a relation with the sales priority of the account, but also a relation with the sales priority per product.
For the targeted use of data, it is necessary that all data can be accessed and retrieved together. Many companies already have central storage for all customer-related data: a data cloud, a data lake or a customer data platform (CDP). In our practice, however, we often find that this data is stored in different systems. In this case, it is important to check how all the data for a use case – like the implementation of omnichannel campaigns – can be brought together into one system. Technically and organizationally, the common CRM systems from Veeva, IQVIA / OCE, Salesforce or Ysura can be used for this.
Metrics – Analytics and Tracking
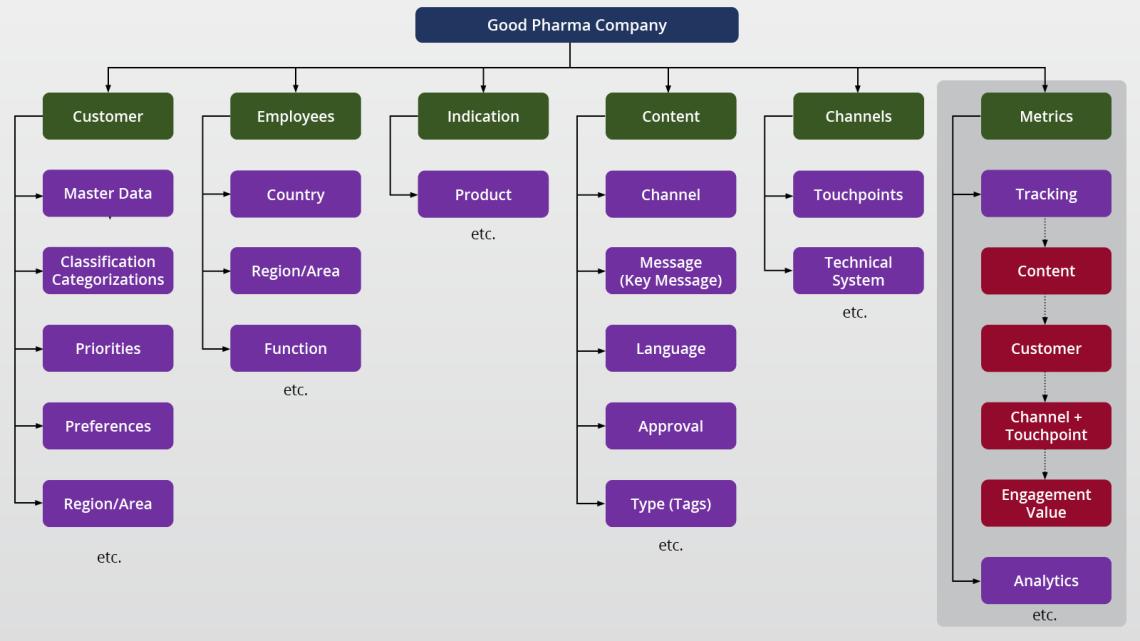
In addition to the existing data on customers and products, further data is generated during campaigns. This data is comprised of measurements or “metrics”. Metrics are measurements, analytics and tracking data that are recorded when a user interacts with a touchpoint in a channel.
Analytics are measurements without knowing “who” is being measured. Analytics are used to make statistical statements about a group of people.
- Example: “44 visits to the website >> Effects of Raxxira® << since this morning”.
These measurements are provided by analytics tools that measure the use of websites and other digital channels. Well-known solutions include Adobe Analytics, Google Analytics and Matomo.

The more specific your metrics and data are, the better your data quality will be.
Tracking is also measurement data, with the difference that this measurement data is linked to a single person.
- Example: “Dr. Heiner Müller clicked on the link >> Effects of Raxxira® << and watched 75% of the video.“
A prerequisite for tracking is that we can measure who is using our digital channels. The user must either reach the touchpoint via a personalized link or register by name.
Data from analytics and tracking are metrics and must be included in the taxonomy tree for a holistic view of all the company's data.
With well-designed and well-maintained organizational and technical foundations, it is possible to make data from digital campaigns usable for the long term. This way, external communication not only generates an effective impact, but also automatically improves your data depth.
Selectors – Addressing target groups accurately
In marketing, we want to address our target groups accurately. “Selectors” are the control element for identifying the right target groups and communicating with them.
Example selectors are
- All Key Opinion Leaders (KOLs) for indication “X“ with classification “Rising Stars“ or “Delegators“.
- All HCPs in territory “A“ or “C“, with a sales priority of “1“ or “2“.
- All HCPs within a radius of “50 KM around Hanover” with a reference to indication “X” or indication “Y.”
- All HCPs, who have “watched at least 50%” of video “Z” on website “z.de” in the “last 4 weeks.”
- All HCPs in business unit “Y” who have moved up the adoption ladder in the “last 3 months.”
Most companies can easily model the first three examples. It gets difficult when it comes to using data from different sources (example 4: CRM and website analytics, example 5: CRM and Power BI) for a selection, as in examples 4 and 5. Only companies that already have access to data from different systems can do this.
In the previous whitepaper in our series on our campaign toolkit, we presented our touchpoint sheets. These contain different metrics for each touchpoint, which primarily serve as measurements for assessing the effectiveness and performance of a channel and touchpoints.
Metrics are also data points that can be used as selectors in the course of a campaign.
An example
An HCP is directed to a landing page with the help of a personalized email. The following tracking metrics are measured for the HCP's individual behavior when visiting the website:
- Duration of visit
- % of video watched
- Which of the documents offered were downloaded?
- Which in-depth pages were clicked?
Let's assume that the downloadable documents were each linked to a key message and the in-depth pages deal with specific product features. This automatically provides precise information about whether the HCP reacts better to certain messages and is possibly particularly interested in one or two product features.
This information – used as a selector for a follow-up mail – allows a targeted approach for each individual HCP.
Surveys on websites or CLM presentations are another example:
Within just a few minutes, valuable information on the HCP's particular areas of focus is collected almost effortlessly, without extra effort for the rep, and automatically stored in the HCP’s CRM profile. This data on an HCP can then be used to make much more accurate selections. These selections can be used in subsequent marketing measures to select channels and for selection within these channels. The possible applications go far beyond this, right up to marketing automation..
Personalized selectors enable the following marketing media to be played out automatically, for example:
- Automatic selection of suitable fragments in approved emails
- Different videos on a landing page are played depending on the selector
- CLM presentations with automatic optimization of flows (preselected sitemap)
- Content blocks on a website in a different order or with different highlighting
The more specific the data collected in metrics, the better the data quality – more specific data collected in metrics automatically results in better data quality. And the better this data is, the more specifically can the target groups be addressed.
We are talking about the precise and accurate targeting of often just 10, 20 or 50 HCPs. Even for rare diseases with sometimes only a two-digit number of HCPs, such a specific approach makes sense because the effort required to create highly customized content is manageable – often even easier than general content that is intended to appeal to everyone.

Even data needs harmony!
Conclusion
Harmonized data is the key to real closed-loop marketing. This requires cross-departmental data from sales, marketing and medical. It also requires data on the use of all channels, transactions and interactions. This data, which must be consolidated and standardized from various sources, serves as a uniform basis for analyses, decisions and targeted communication. Good and specific data enables coordinated customer journeys and campaigns, with messages tailored to the individual HCP on all channels.
If data is missing or cannot be accessed, the resulting analyses are incomplete or even incorrect. There is a high risk that communication will fizzle out ineffectively because the wrong addressees are chosen or the right addressees are addressed at the wrong time.
Previous whitepapers in this series:

Christian Rütgers // Technical Consultant
With almost three decades of expertise in sales automation and digital marketing, Christian has devised and successfully implemented a wide range of innovative projects. He knows how to solve difficult problems and develops solutions that are occasionally unconventional, but always the right fit.

Tim Neugebauer // Digital Engagement Consultant
Tim is an expert in engagement of any kind. Whether digital or analog, he ensures that your content finds the optimal route to its target. Vault Platform Associate Administrator & IQVIA OCE Digital certified.
